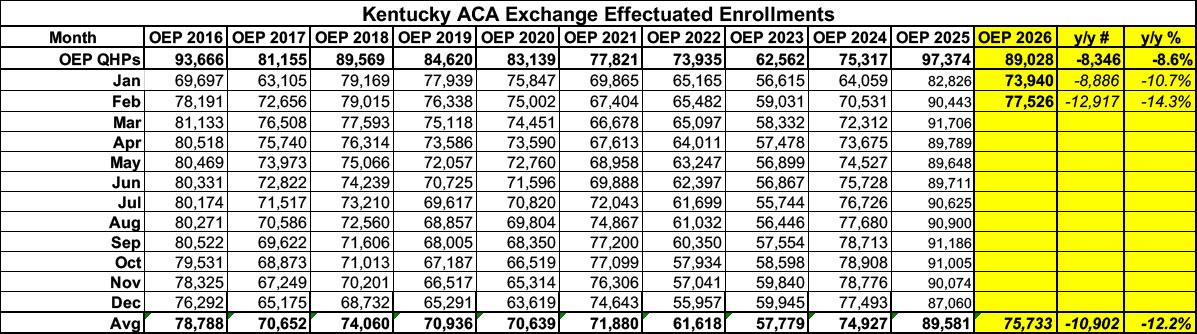
Before I begin, it's important to note that ACA exchange enrollment has dropped significantly in Kentucky since Congressional Republicans allowed the enhanced federal subsidies to expire at the end of last year.
Initial signups during Open Enrollment were down 8.6% vs. OEP 2025...but effectuated enrollment was down nealry 11% in January and over 14% as of February; on average nearly 11,000 Kentuckians lost ACA healthcare coverage in the first two months of 2026:
Here's what this looks like visually, with both 2025 and 2019 (the last pre-COVID year, which didn't include the enhanced subsidies) included for comparison:
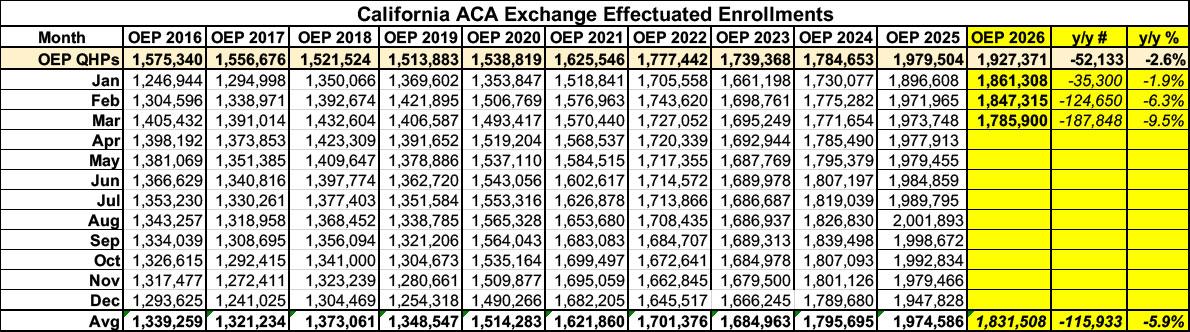
Before I begin, it's important to note that ACA exchange enrollment has dropped in California since Congressional Republicans allowed the enhanced federal subsidies to expire at the end of last year...although thanks to the state providing its own supplemental financial subsidies to partially cancel out the lost federal subsidies, it's not nearly as dramatic a drop-off as in most other states.
Effectuated enrollment was down 9.5% year over year as of March, and has almost certainly continued to drop further since then based on the trend line (see below). That's at least 187,000 fewer Californians enrolled in ACA healthcare coverage this year.
The chart below contains proposed rates for Plan Year 2027, which will be reviewed for compliance with federal and state requirements. Please submit any comments to DOI.HealthRateReview@illinois.gov by Friday, July 10, 2026.
Every year around this time I start my annual individual & small group market rate filing analysis project. This involves spending months painstakingly tracking every insurance carrier rate filing for the upcoming year to determine just how much average insurance policy premiums on the individual market are projected to change.
Carriers tendency to jump in and out of the market, repeatedly revise their requests, and the confusing blizzard of actual filing forms sometimes make it next to impossible to find the specific data I need.
The actual data I need to compile my estimates are actually fairly simple, however. I really only need three pieces of information for each carrier:
How many effectuated enrollees they have in ACA-compliant policies this year;
The average projected rate change for those policies;
Ideally, a breakout of the reasons behind the changes.
Usually the reasons given are fairly vague things like "increased morbidity" (ie, a sicker risk pool) or the like. Sometimes, however, there's a very specific reason given for some or all of the premium changes. Major examples of this include: