

How much more are ~130,000 MINNESOTA ACA enrollees *really* paying this year due to Trump/GOP policies?
Mon, 06/15/2026 - 7:00pm
IMPORTANT: See the original post in this series for an explanation of the methodology.
Regular readers know that I've been obsessing over the massive increases in both gross as well as net premiums for ACA health insurance policy enrollees being caused by the combination of Congressional Republicans allowing the enhanced federal tax credits to expire as well as other Trump Regime policy changes for well over a year and a half now.
I've written countless analyses of how much both gross and net premiums skyrocketed from 2025 to 2026 across different states, different income levels and various other demographics...and last week it was revealed that over 3 million ACA exchange enrollees had already been priced out of the market as of April, with the number almost certain to climb further throughout the rest of 2026.
As I've repeatedly warned, however, the increases in premium costs (whether gross or net) are only half the story. The other big shoe which is dropping this year is increased out of pocket costs as millions of the ~19.2 million or so remaining enrollees as of April have been forced to downgrade their coverage to avoid (or at least minimize) those massive premium spikes.
In most cases this means moving to plans with higher deductibles, higher co-pays & higher coinsurance costs. In many cases this has also included moving to plasn with worse networks, referral requirements to see specialists and so on.
With that in mind, that's exactly what I've decided to set out to do: Calculate the average year over year increase not just in net premiums (that is, how much more ACA enrollees are having to pay each month) but also the year over year change in average out of pocket costs.
Let's look at MINNESOTA:
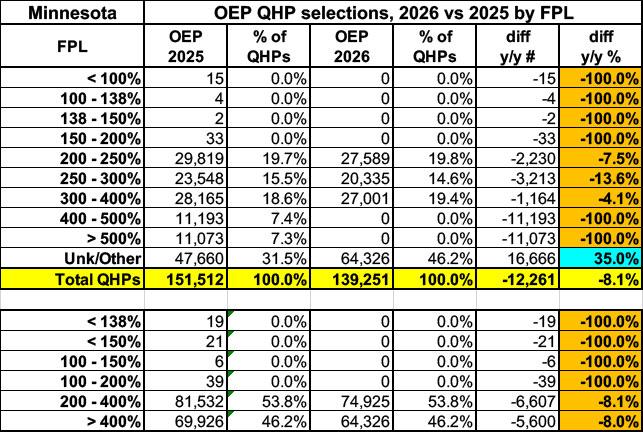
Here's a look at ACA exchange plan selections during Open Enrollment by household income level this year vs. last.
- IMPORTANT: Minnesota is one of just three states, along with the District of Columbia, which has a Basic Health Plan (BHP) program in place specifically designed for residents who earn more than the cut-off for Medicaid expansion (138% of the Federal Poverty Level) but less than 200% FPL. As a result, virtually all ACA exchange enrollees in Minnesota earn more than 200% FPL, which dramatically skews not just the income bracket breakout (of course) but the metal level & Actuarial Value distributions as well.
Enrollment below 200% FPL has dropped off to nothing, but as noted above, it was always nominal to begin with (I'm honestly not sure who the handful of exceptions were last year, but this year even they seem to have disappeared).
Enrollment at every other income bracket has also dropped. Most curiously, enrollment over 400% FPL has not only dropped off (which is understandable given that this population is no longer eligible for federal subsidies at all), but has supposedly dropped off completely, to literally no enrollees, which I find difficult to believe...especially since the "Unknown/Other Income" bracket has increased by a whopping 35% at the same time. I'm assuming most of the additional 16,666 "Unknown/Other Income" enrollees actually have incomes over 400% but were categorized differently this year for whatever reason.
In any event, overall plan selections were already down more than 8% out of the gate:
OK, onto the main analysis:
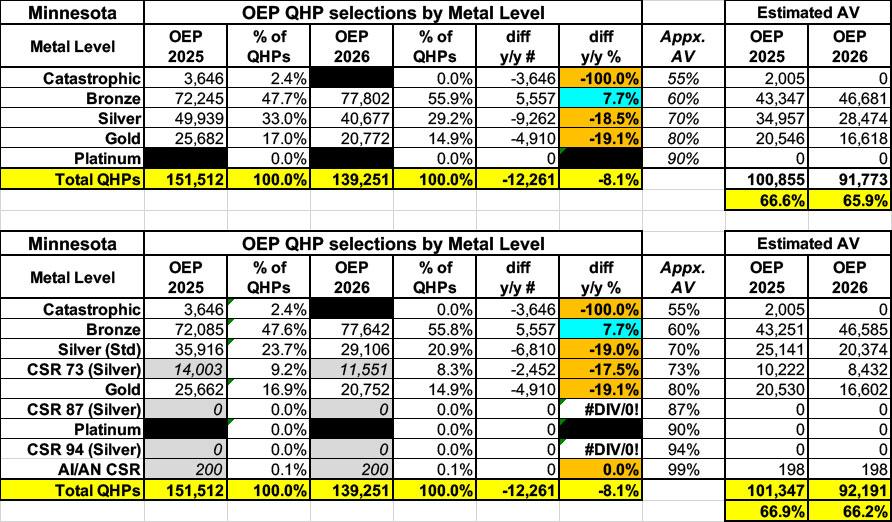
Here's total Open Enrollment plan selections for both 2025 & 2026 broken out by Actuarial Value (AV) category. The first table is based on official metal level tiers, but it's the second table which is critical, since a huge chunk of ACA enrollees are usually enrolled in CSR Silver plans (which include Cost Sharing Reduction assistance). CSR assistance dramatically boosts the AV of Silver plans up to Platinum levels in most cases.
Note that I said "usually." Two of the 3 CSR tiers are only available to enrollees who earn less than 200% FPL, and since Minnesota's BHP program offloads residents who earn < 200% FPL to it anyway, that means there's only a small number of CSR enrollees here, nearly all of whom are in the least-generous variant (CSR 73).
As a result, the overall Actuarial Value of Minnesota enrollees isn't very high either year...and only dropped slightly this year, to 66.2% AV:
By combining these numbers with the average gross premiums per enrollee I'm able to calculate an estimate of the average total medical expenses each enrollee racks up each year assuming an 80% average Medical Loss Ratio (as I stated in the original post, this can vary widely by carrier and year, so should be considered a very broad average only), which looks like so:
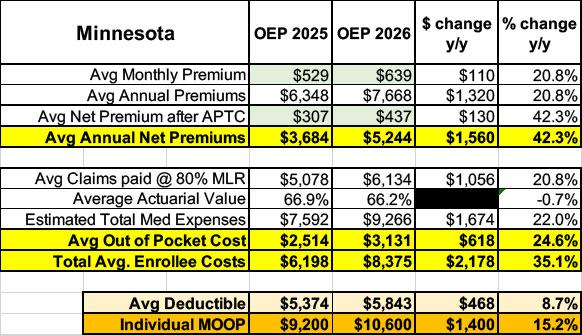
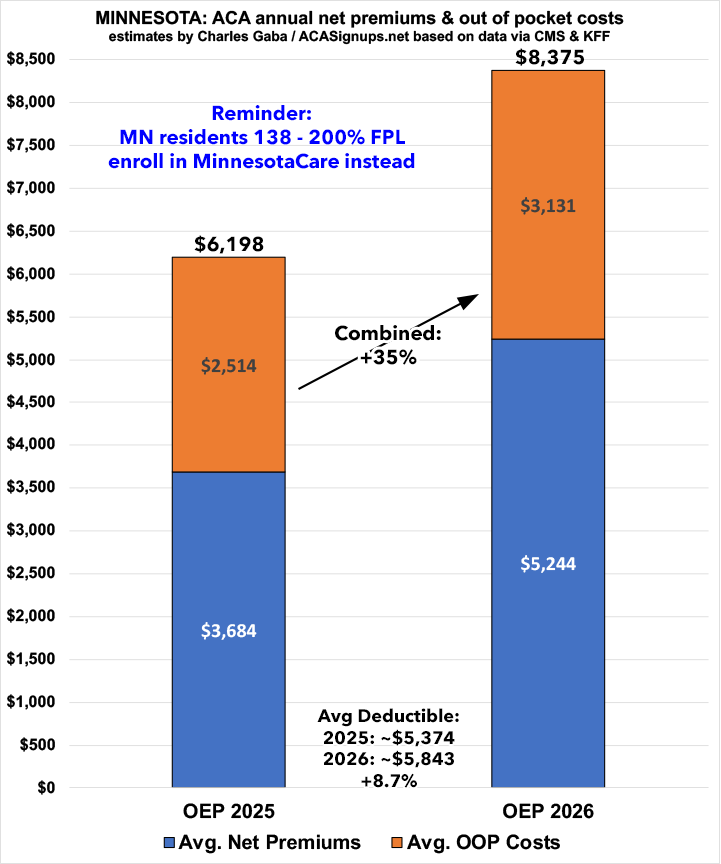
The ~130,000 enrollees who signed up during Open Enrollment have seen their net premiums jump by ~42% on average, from ~$3,700 to over $5,200 per year.
In addition, their average out of pocket expenses have also gone up ~25%, for a combined average healthcare cost increase of ~35%.
That's an increase from ~$6,200 to nearly ~$8,400 per enrollee this year...nearly $2,200 more apiece.
In addition, based on KFF's net data, average deductibles also increased by ~9% to ~$5,800 for single coverage this year, and the maximum (theoretical) out of pocket cut-off for all ACA enrollees went up by over 15% this years as well, to $10,600 for single coverage.
Next up: MISSISSIPPI.
Advertisement
