

Washington: Effectuated ACA enrollment down 11 - 16% so far; over 46,000 have already lost coverage
Wed, 05/06/2026 - 11:05am
Once again: The true measure of ACA healthcare coverage enrollment isn't how many people select policies during the Open Enrollment Period, it's how many actually have those policies in effect (aka "effectuated enrollment").
via the Washington HealthPlanFinder:
Unprecedented number of Washingtonians drop health insurance following Congress’ failure to renew enhanced premium tax credits
New report shows expiration of enhanced premium tax credits resulted in nearly 13 percent decrease in qualified health plan enrollees compared to last year
Olympia, Wash. - Nearly 250,000 Washingtonians either selected or re-enrolled into a qualified health plan (QHP) during open enrollment. After Congress allowed the enhanced premium tax credits to expire at the end of 2025, nearly 13% fewer Washingtonians enrolled in a QHP than last year’s more than 286,500. There has not been a drop of this magnitude since Washington Healthplanfinder was launched in 2012. The findings were released today in the Washington Health Benefit Exchange 2026 Spring enrollment report.
This report shows a number of important trends.
Enrollment counts are significantly down from what was initially reported in the 2026 Open enrollment preview report, when open enrollment closed in January. At the end of open enrollment, nearly 40,000 fewer people signed up than last year. Now, with information about who has paid for their coverage, another 14% of Washingtonians have dropped their health insurance. Historically, this number is 7–10% lower than reported in the preview report revealing nearly twice as many customers opting out of coverage.
Despite federal policy changes, Washington state’s mitigations efforts — including state premium assistance Cascade Care Savings and premium alignment — have helped to reduce the impact of federal changes. Those efforts were able to help stabilize the average net premium for federally-subsidized people with incomes 100–400% of the federal poverty level.
“With the passage of H.R. 1 and the expiration of federal enhanced premium tax credits, many customers experienced a doubling or tripling of their premiums this year and faced hard decisions about whether to stay covered,” Exchange Chief of Communications Tara Lee said. “We know our state mitigation efforts have made a difference, and the coverage losses could have been greater. However, we anticipate that ongoing federal changes and mandates will continue to impact affordability and access. The Exchange is committed to our mission of radically improving how Washingtonians secure health insurance through innovative and practical solutions."
In times of change and uncertainty, customers rely on trusted partners to help them sort through their choices. During this open enrollment, brokers, navigators and Customer Support Center representatives were instrumental in clarifying savings, tax credits and policy changes. The Exchange’s extensive network of statewide assisters helped approximately 49% of QHP enrollees find and select their 2026 health insurance.
Learn more about Washington Healthplanfinder customers in the 2026 Spring enrollment report, accessible at wahbexchange.org.
Before I continue, it's important to note that the WA exchange uses slightly different methodology for their enrollment numbers than the Centers for Medicare & Medicaid Services (CMS) does in their official Public Use Files (PUFs), so some of the percentages & rounded numbers in the press release & WA report will differ a bit from the spreadsheets I post below, but the trends are the same and just as dire.
via the actual spring enrollment report:
In this report, you’ll find reflections on our 2026 open enrollment period, which ran from Nov. 1, 2025, to Jan. 15, 2026, and special enrollments since. Included are data and statistics about enrollment counts and demographics for all Washington Healthplanfinder customers — both those in Washington Apple Health (Medicaid) and qualified health plans (QHPs).
The content of this report differs from the 2026 Open enrollment preview report because it contains data about the customers who effectuated, or paid, their first monthly premium and additional customers who signed up with special enrollment periods this spring.
Since the report is dated "May 2026" and is called the "2026 Spring Enrollment Report," it's important to note this detail:
...Qualified health plan (QHP) and qualified dental plan (QDP) data includes enrollees with health insurance during February 2026 who made their first payment as of March 31, 2026.
In other words, the actual effectuated enrollment data itself is as of February, not March, April or May.
Coverage type: Qualified Health Plan (QHP): 249,977
With that in mind, here's what it looks like compared with the official CMS monthly effectuated reports from prior years, including 2025:
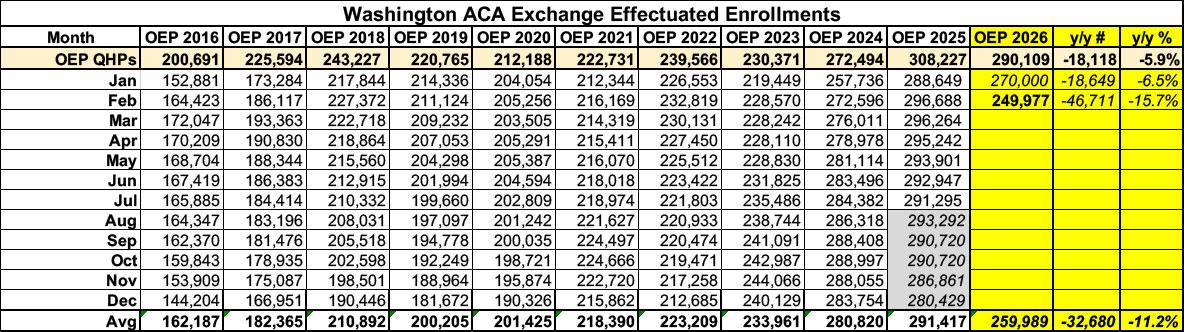
Again, while the press release lists enrollment as being down ~13% vs. last year so far, for February specifically it's actually 15.7% lower than it was as of February 2025 (although the average for January & February combined seems to be more like 11.2%, though I had to make an educated guess as to what January effectuated enrollment was).
It's important to reiterate that it's the April data which will be the most telling, since he ACA requires insurance carriers to provide a 90-day grace period for non-payment of premiums.
Here's the metal level breakout as of the end of Open Enrollment (again, this is not the same thing as effectuated enrollment). Note that the breakout of CSR categories (73, 87, 94 & AI/AN) are estimates, and the AI/AN numbers are especially questionable since a chunk of these should likely be drawn from Bronze plans:
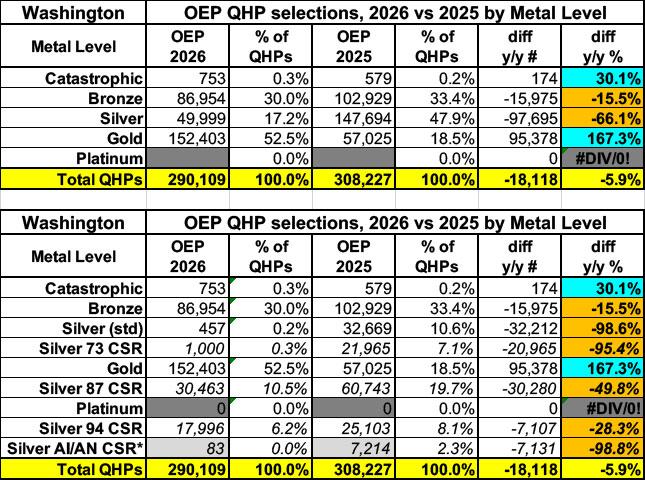
As you can see, unlike most states so far, Washington saw a massive spike in Gold enrollment thanks to them newly embracing full Premium Alignment (which they actually cite in the press release). Having said that, it looks like only about 2/3 of the increase in Gold enrollment came from Bronze, Silver or Silver 73 enrollees upgrading...the other third seems to have come from enrollees in Silver 87 & Silver 94 enrollees downgrading to Gold instead.
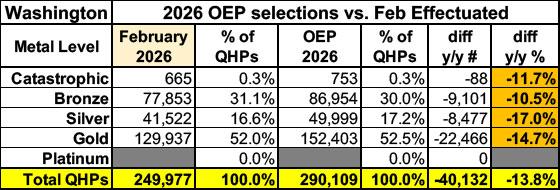
The metal level breakout of effectuated enrollment as of February is noteworthy in that the report doesn't mention Catastrophic plans at all, although I was able to calculate it by simply subtracting the Bronze, Silver & Gold numbers from the total. Enrollment has plummeted by double digits at all four levels since the end of OEP:
Here's the breakout by income bracket...for both Open Enrollment Period selections (2026 vs. 2025) as well as February effectuated compared to the OEP numbers:
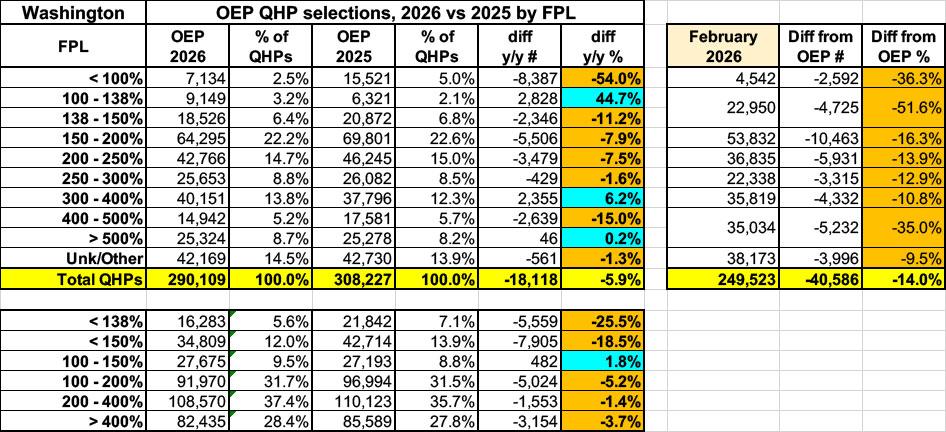
Unsurprisingly, enrollment under 100% FPL has dropped off a cliff due primarily to the Trump Regime no longer allowing recent documented immigrants to be eligible for federal tax credits; fewer than half as many signed up at all, and another third of those who did had already dropped coverage by February.
Enrollment in other income brackets mostly dropped by less significant levels during OEP, although effectuated enrollment thru February saw even more dramatic drop-offs (the February total is missing a few hundred people for whatever reason).
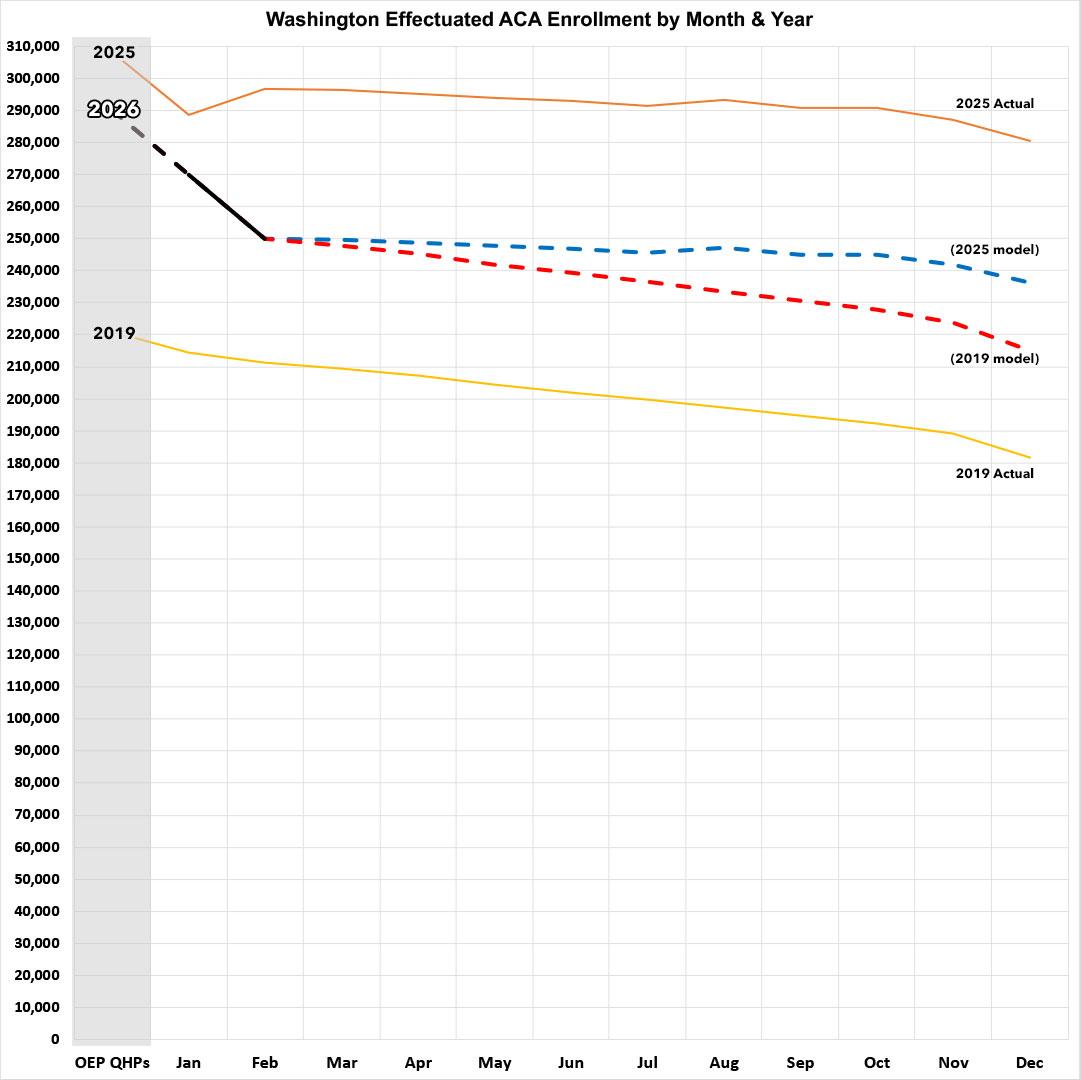
In any event, here's what effectuated enrollment will look like for the rest of the year in Washington assuming it follows either the 2025 or 2019 patterns:
- If the rest of the year follows the 2025 pattern, effectuations will end December at around 236,000 and will average around 247,000 for the year...down 15% compared to 2025.
- If the rest of the year follows the 2019 pattern, effectuations will be at around 215,000 by December, and the average for the year will be around 238,000...down 18% y/y. That would mean around 53,000 fewer people having ACA healthcare coverage than last year.
Here's what things look like across the 7 states I've run effectuated numbers for so far:
- Colorado: OEP down 1.9%; March effectuations down 6.1%
- California: OEP down 2.6%; February effectuations down 8.5%
- Massachusetts: OEP up 3.7%; April effectuations down 4.3%
- New Jersey: OEP down 0.8%; April effectuations down 11.6%
- Georgia: OEP down 12.3%; April effectuations down 28.1%
- Maryland: OEP up 3.4%; April effectuations down 6.3%
- Washington: OEP down 5.9%; February effectuations down 15.7%
In terms of year over year average monthly effectuated enrollment as of the months of the latest data:
- Colorado: Down ~13,400
- California: Down ~110,000
- Massachusetts: Up ~1,600
- New Jersey: Down ~57,000
- Georgia: Down ~370,000
- Maryland: Up ~7,000
- Washington: Down ~33,000
- Total across 7 states: Down at least ~578,000
There's a bunch of other wonky demographic data available in the actual Spring 2026 report as well.
Advertisement
